Use data visualization to create your own graph to help you understand big problems in the world. You will code an animation which will allow you to jump from image to image with a fade-in/fade-out effect.
How to Play:
- Start the Game: Click the green flag to begin & the space bar to reset.
- Chart the Data: Follow the instructions to plot YEAR 2015?
Scratch Coding Activity
Get “under the hood” of our data visualization activity! This guide walks you through the steps to remix the Scratch simulation in our last activity. You’ll learn how to modify the code and rules to build your own unique version!
LET’S REFLECT…
Reveal the data story below, and reflect on the following questions:
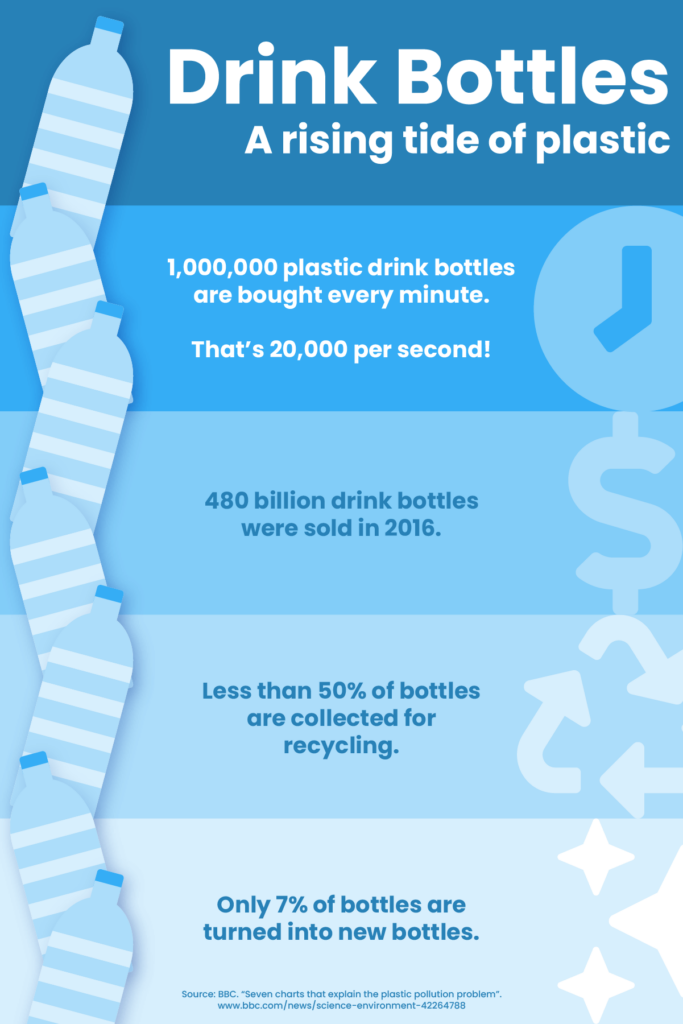
- General: Can you estimate how many bottles are bought every hour, day, and week?
- Community: Does your school or community have recycling programs?
- Ethical: Can you find out how much plastic waste your town or city recycles? Do you think it is enough?